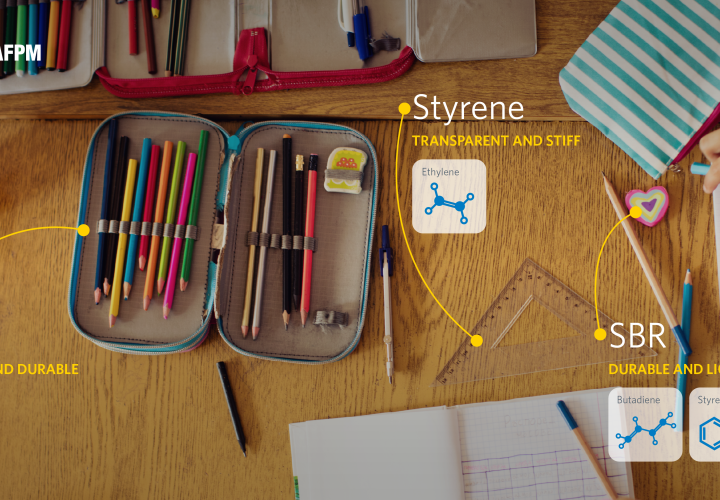
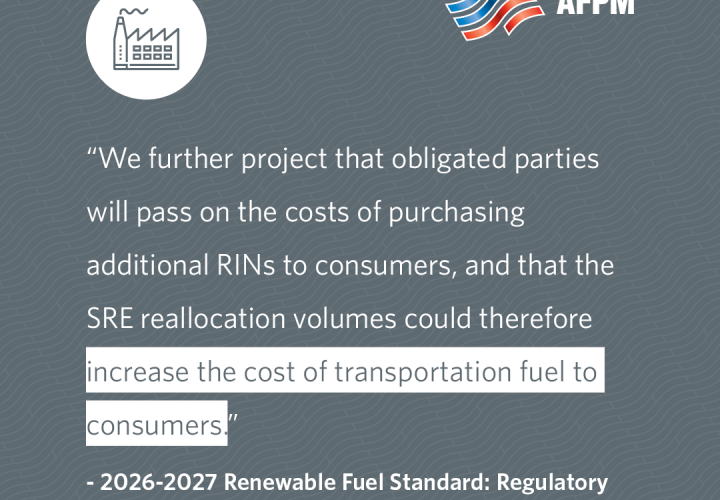
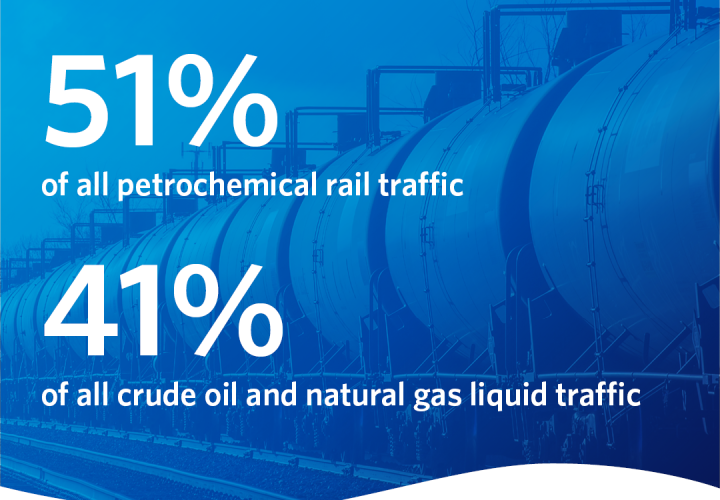
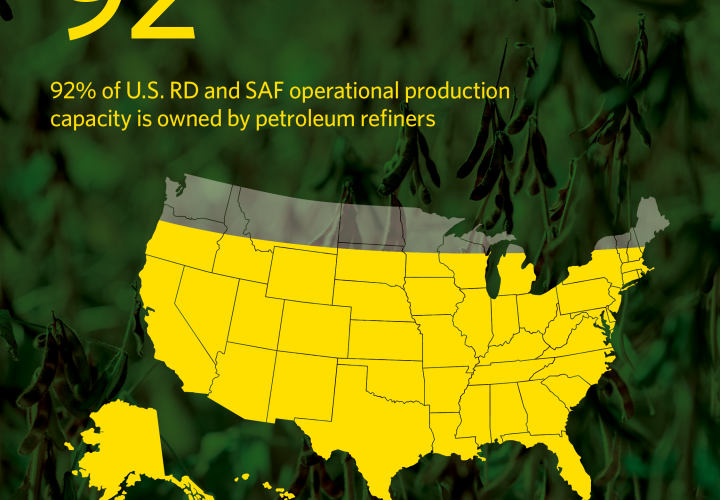
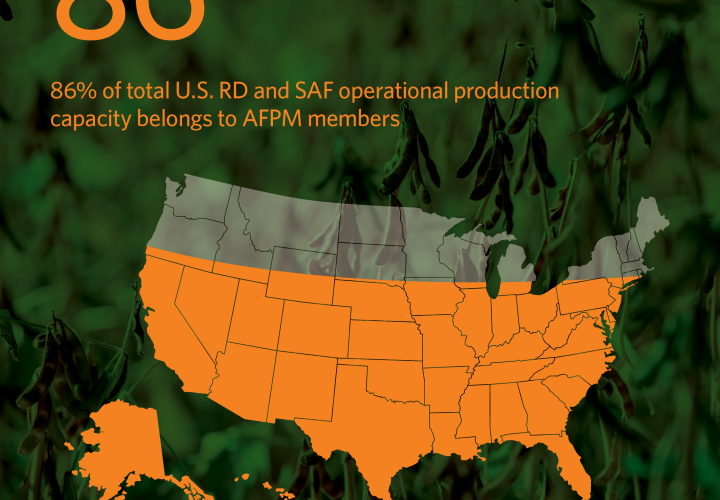
Resource Library D379BC8F-525F-422B-ACAC-1D65DBF8387A Environment 40F0A4B8-673E-48BD-9E6A-6C137114C476 Safety Economic Impact Industry Basics 85289C24-6FF9-4E96-9BAF-B62E45BC9239 Issues Markets & Supply Viewing 103 Results Advanced Search Resource Topics Environment Safety Economic Impact Industry Basics Issues Markets & Supply Community Resource Type Fact Sheet Infographic Podcast Presentation Video Apply Filters Reset Filters Viewing 103 Results Infographic Products Powering Progress - Back to School 2 Binders, sneakers and backpacks. All these school supplies — and more! — are made from petrochemical building blocks, thanks to the hard work of America’s refiners and petrochemical manufacturers. Infographic Products Powering Progress - Back to School 1 From erasers to protractors, America’s fuel refiners and petrochemical manufacturers create the building blocks used to make school supplies. 85289C24-6FF9-4E96-9BAF-B62E45BC9239 Infographic EPA on Renewable Fuel Standard costs In their own Regulatory Impact Analysis, the Environmental Protection Agency projects that the 2026-2027 Renewable Fuel Standard will "increase the cost of transportation fuel to consumers." Infographic Rail merger impact If approved, a proposed rail merger would hand a new "mega-railroad" 51% of all petrochemical rail traffic and 41% of all crude oil and natural gas liquid traffic. Infographic The petrochemicals keeping doctors and nurses safe Doctors and nurses rely on petrochemical building blocks like propylene to make their disposable surgical caps and gowns. Just another example of how AFPM members are making products every day that improve our lives. Infographic Gas price factors Gasoline prices are complicated and influenced by a number of intertwining factors and supply chain issues. The cost of raw crude oil that is used by refineries to produce gasoline accounts for more than half of the price drivers see at the pump. Infographic Petroleum refiners' contribution to U.S. RD and SAF operational production capacity (alt) Infographic showing that 92% of U.S. RD and SAF operational production capacity is owned by petroleum refiners (square image). Infographic Petroleum refiners' contribution to U.S. RD and SAF operational production capacity Infographic showing that 92% of U.S. RD and SAF operational production capacity is owned by petroleum refiners (rectangular image). Infographic AFPM members' contribution to U.S. RD and SAF operational capacity (alt) Infographic showing that 86% of total U.S. RD and SAF operational production capacity belongs to AFPM members (square image). Pagination Previous page Next page